It is no secret that I like headphones.
By no means, I consider myself an audiophile. I occasionally wander on the forums where those people gather, and I am amazed by the knowledge and passion those people exhibit. I merely enjoy listening to music, podcasts, and audiobooks on devices that I think produce excellent audio quality, based on my standards and knowledge.
Mine pursue for a good audio quality started almost a decade ago, as part of which I realized that I would like (or wish) to get a pair of headphones capable of producing excellent audio quality. Other requirements included a microphone for occasional conference calls, Bluetooth technology (I am not a huge fan of cables), and ideally solid battery life.
Now, the thing is – having good headphones is by no means requirement. It is a wish. And back then, the difference between different brands was more prominent, and that came with the price. But that is usually the way it works with things that are not mandatory. They arrive at a cost.
Sennheiser MM400
After much consideration, reviews, and doubt, I decided to get Sennheiser MM400 headphones.

I needed a good pair of headphones for office use, and those had everything, well, almost everything that I needed from them.
They were Bluetooth, so they offered cable freedom. Cable freedom was only a dream back then. They were stereo, on-ear headphones with excellent audio quality. Battery life was quite good, but they also came with a direct cable option, which made them excellent travel companions, too. I liked those.
The audio quality of these headphones was pretty good. I clearly remember comparing those with some other, for this blog post purposes, unnamed vendors, that some of my colleagues were rocking at the time. In the majority of the cases, I would find their audio quality to be sub-par compared to MM400. Especially when compared to active noise-canceling headphones – I would find those to sound dull compared to MM400.
I had them for a considerable amount of time and enjoyed using them. The fairytale continued until the day I accidentally jumped on the bed to get some rest, while, unbeknownst to me, headphones were there.
The damage was real. The left ear tip was hanging from the rest of the body just by wires, and the headband wasn't in the best shape either. I was not happy with the outcome of the situation for which I was entirely responsible.
However, I decided to reach out to Sennheiser to check if there is anything that they can do about it. I was willing to pay for the repairs.
Now, living in Ireland comes with some benefits. It turns out that Sennheiser has quite a large manufacturing operation in Dublin, so after filling the support ticket, they just asked to ship the item to them. I don't think I had any warranty on those. I bought them on Amazon, and their product warranty expired. Moreover, I don't believe that Amazon counts (or at least it did not back then) as an authorized reseller of their headphones, so there was a limitation from that perspective, too.
Ten days later, I got a phone call from Sennheiser representative from Ireland informing me that the headphones were fixed at no cost. So, let me get this straight – the damage on the headphones was entirely my fault, yet Sennheiser decided to fix them free of charge. How cool is that?
Besides that awesome news, I clearly remember having an excellent conversation with a representative on audio quality, the current state of noise cancelation technologies in Sennheiser headphones.
This type of fantastic support is what acquires long term users, and most certainly, that was the case with me.
Around that time, Sennheiser released Momentum series headphones and given positive user experience, trusted brand, and excellent audio quality that I got used to, meant it is time for an upgrade. I gifted my fully operational MM400s (and they are still rocking to this day!) and got myself first-generation Momentums.
Sennheiser Momentum
Sennheiser Momentums are wired, over the ear, headphones. However, at this stage, I did not care. They were such a game-changing consumer product that I was willing to overlook that and enjoy everything that they had to offer.

Mainly, ridiculously excellent audio quality for closed-back headphones. The sound coming out of those was so vibrant and enjoyable that not long after I purchased my pair, some of my teammates did the same. They just recognized the quality and what those headphones had to offer, and then resistance was futile.
They are over the ear headphones that came with a connecting cable that has music controls on it. Besides that, they were not foldable and came in high quality but somewhat bulky hard carry case. They were good travel companions too and came with all the cables and connectors to make your long airplane trips enjoyable (despite the sizeable hard carry case). I've used these for quite some time (years) and then noticed that Sennheiser listened to the feedback and produced something that I wanted.
Sennheiser M2AEBT
I've sold my Sennheiser Momentum (first generation) and straight away bought Sennheiser Momentum M2AEBT (they used to be known as HD1, too).
Those headphones have everything that I needed from the headphones. They are foldable, over the ear, wireless headphones with fantastic audio quality, and at the top of everything, they have Active Noice Cancellation!

M2AEBT for me sounded different compared to first-generation Momentums. The sound wasn't as vibrant as before, but that could have been an effect of going wireless after using wired headphones for so long. Not sure if that is the reason, but I could feel the difference.
That being said, by no means, Sennheiser Momentum M2AEBT sounded worse. It is just that I could feel it. I've got used to the new sound pretty easy, but then I noticed something that I wasn't expecting:
Sound dropouts. I was using these headphones extensively, and on the way to my office, I would cross a rather large bridge where short, but definitely, noticeable sound dropouts would happen. I think that the reason was related to the fact that the signal didn't have anything to bounce from and other potential issues with antennas. It was annoying, but not the point where I would return the product. A year into using those headphones, I've noticed that they started developing another problem. This time it wasn't something that I could unsee, literally. The color began to peel off. By researching the problem some more, and checking head-fi forums, I realized that I am not the only person affected by both issues and that Sennheiser acknowledged the problem.
I've reached out to Sennheiser Support, and they asked me to send the pair back for the inspection. Not long after that, I've received a brand new pair of headphones! It seems that Sennheiser managed to pinpoint all the problems and successfully resolve them. The pair that I got back from Sennheiser (brand new one) is still the headphones that I am using to this day. And they still work amazingly well!
I know that Momentum 3.0 is released. But, honestly, I don't have any reason to update, and I don't intend to. Would I like 3.0? Of course. Do I need them? No, my M2AEBT gets the job done.
Sennheiser 6XX
Going from headphones to better headphones is a risky path to follow. Inevitably, you end up down the rabbit hole of wanting more and better and me getting Sennheiser 6XX (which are effectively Sennheiser HD 650) after years of pushing back is no different.

Even though Massdrop sold more than eighty thousand of these and that end of the stock is nowhere to be seen, fear of missing out, after years of resistance got better of me, and I purchased them.
And yes, one of the bonuses of these is the fact that they are produced in Ireland, where I live!
While these headphones come with the cable that is going to make it possible to connect them to the laptop or your machine, you know you are not going to get the best out of them. There are many factors to consider, including the fact that those are 300ohms headphones that need much power thrown at them. Besides that, do you trust your computer with likely mediocre sound card to perform as a worthy DAC and Amp? I didn't think so, either. What that entails is that you are going to end up purchasing DAC and AMP or combo.
After spending who knows how long time researching the subject, and despite the fact it is not recommended to buy those combos, I've settled on Schiit Fulla 2. It is sweet, small factor DAC and Amplifier combo that gets the job done, and I was perfectly happy with it until I stumbled onto something that was (at least it seems like that) made to work with Sennheiser 6XX. Ladies and gentlemen, let me present Massdrop CTH + SDAC DAC/AMP:

As it usually goes with things, having things almost exclusively (based on the power that it can output) made for something is typically a proper way to go. At the top of everything, it is Tube Hybrid Amp, which is making things more interesting.
There is not much to say about headphones. Sennheiser HD 650 (or Sennheiser 6XX) is one of the reference models for other headphones, and that alone tells it's own story. Are there better headphones? Yes. But even those are way over my requirements or anything that I need from headphones.
They are large and extremely comfortable headphones (by far the most comfortable headphones I ever tried), they are cabled, and if you noticed my requirements for the headphones from the start of this post, they are opposite from what I wanted. But I do like these a lot!
Interestingly, upgrading to a new model of the headphones, at least in my case, always had the same effect. I could notice a sound difference when I was going from MM400 to Momentum (first generation) and then to M2AEBT and, most recently, Sennheiser 6XX.
Sennheiser Momentum True Wireless
I'll admit it: this was an impulsive purchase. Good one, but impulsive.
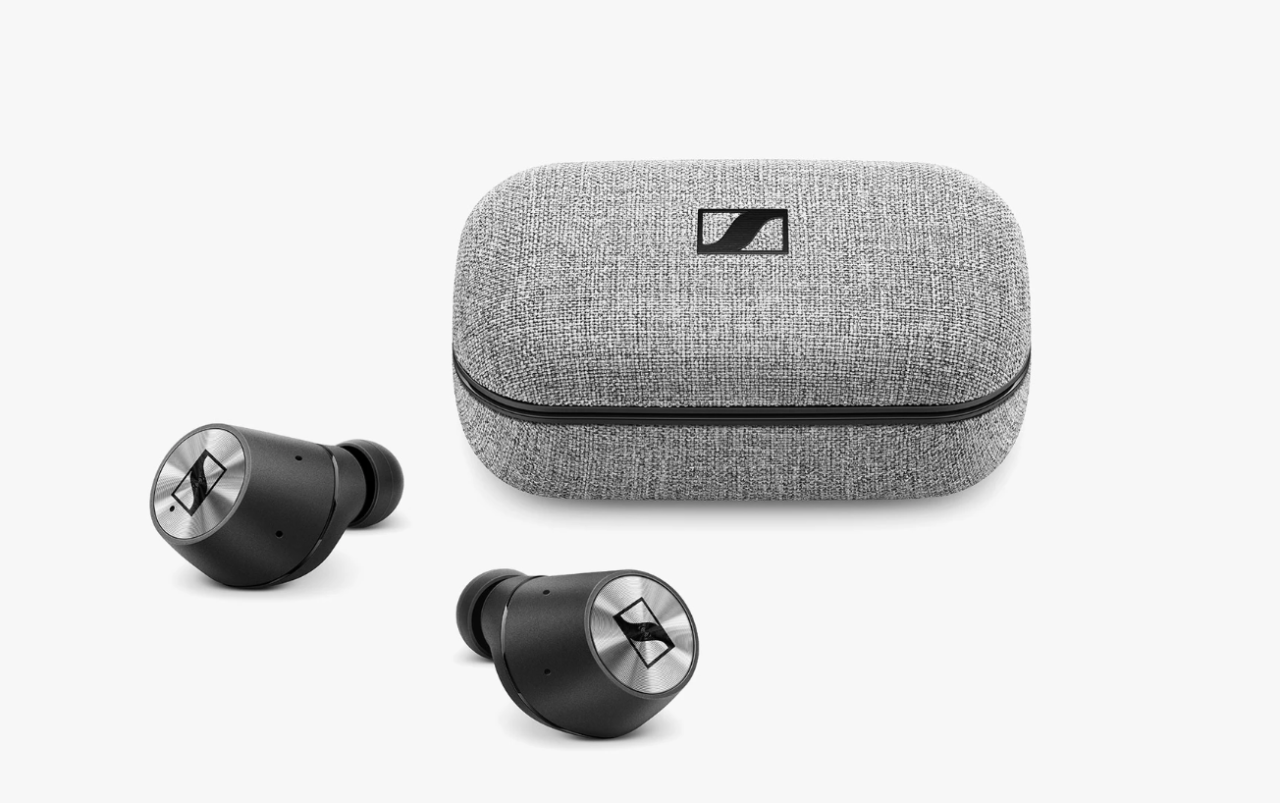
I was visiting San Francisco when I noticed that, unbeknownst to me to that point, Sennheiser released True Wireless headphones. It was fantastic timing, given the fact that I, unfortunately, lost my pair of reliable and excellent Earin M-2 true wireless earbuds, while on a family trip to London.
I gave them a try in the store and liked the sound, and at that point, touch controls on these were the best on the market (they supported increasing/decreasing volume by touch, which at the time was not something that competition had). Comfort was pretty good as well.
Battery life is not bad, but it could be better, but for the purposes that I have these headphones for, battery life of 3 – 4 hours is enough (and with charging box, it extends to 12 hours).
Audio quality is quite good (they support the latest Bluetooth standard, 5.0), touch controls are intuitive, and they have built-in microphones, which is quite useful when you need to answer the call or jump into the conference quickly. Note, the phone call quality could be better, but given the position and placement of microphones (which are almost in your ears), it is entirely acceptable.
I did, however, just recently experience the problem with these, exactly one year after purchasing them. After playing an audiobook, I've put earbuds into their charging box so that I can have a civilized conversation with my friend. They charged, but after I pulled them out, only the right one produced the sound, while the left one stayed silent. I tried to troubleshoot the problem, which included restarting them to factory defaults, but that, unfortunately, did not make too much difference. Interestingly, touch controls on the faulty bud worked fine.
This is the part where I tell you about amazing Sennheiser Customer Support, right? Well, yes. These came with two years of international warranty, so the only thing needed was to open a case with them. They provided a return label to ship them back to Sennheiser, and they informed me that depending on the defect, it could take between 5 to 10 days to get them back, which is not bad at all.
On various headphones reviews and comparisons
From time to time, I check some product reviews as part of which various pairs are getting reviewed and compared against each other. The pattern is almost always the same. Sennheiser will give you the best audio quality for the money that you spend, Bose and Sony are going to be tied for the first place in Active Noice Cancellation while AKG and others have their respective niches. However, very often, I feel like those comparisons don't make too much sense. First of all, it is somewhat subjective.
They sound like that to the person that is reviewing them, not you. Then feature sets of the headphones are widely different (which changes use cases). Some headphones are water and splash resistant while others are not, yet they get reviewed in the same category. The same goes for other features, too.
My take on this is that headphone reviews, especially those that are focusing on audio quality, are subjective. Regardless of the headphones being reviewed, and audio quality that headphones produce, it is still highly dependent on how we experience that sound. Yes, they are people that know a lot about bass, treble, highs, and lows, but at the end of the day, it is pretty subjective.
One gets used to a specific audio quality, and then any deviation from there is a kind of new exploratory territory. There are, however, measured metrics such as Harmonic Distortion, Frequency Response, etc, that could if you are knowledgeable enough tell a lot. But besides those, it is somewhat subjective.
Conclusion
Ultimately, it is not about a brand. I happened to choose Sennheiser, not only because of excellent audio quality but also because of fantastic customer support early in my journey. Product reviews are useful but don't make your purchasing decision purely on them. If anyhow possible, try them first before purchasing. Your experience might be entirely different from mine or the person that you watched a product review from. Ensure that they are comfortable, produce excellent audio quality and that you are happy with them. That is what ultimately matters.